Evidence from the 12th to 14th Finance Commissions of India
Biswajit Mukherjee
B.Sc. Economics (Hons), Semester V
Department of Economics | Ramakrishna Mission Vidyamandira, Belur Math
Do states politically aligned with the ruling Central government receive disproportionately higher fiscal transfers compared to non-aligned states?
Weighted mean analysis of per-capita devolution across aligned vs. non-aligned states using official Finance Commission data (2005-2020).
Fiscal devolution has progressively become more formula-based and institutionally neutral, with evidence of systemic political bias.
Comprehensive analysis across three Finance Commissions: 12th (2005-10), 13th (2010-15), 14th (2015-20).
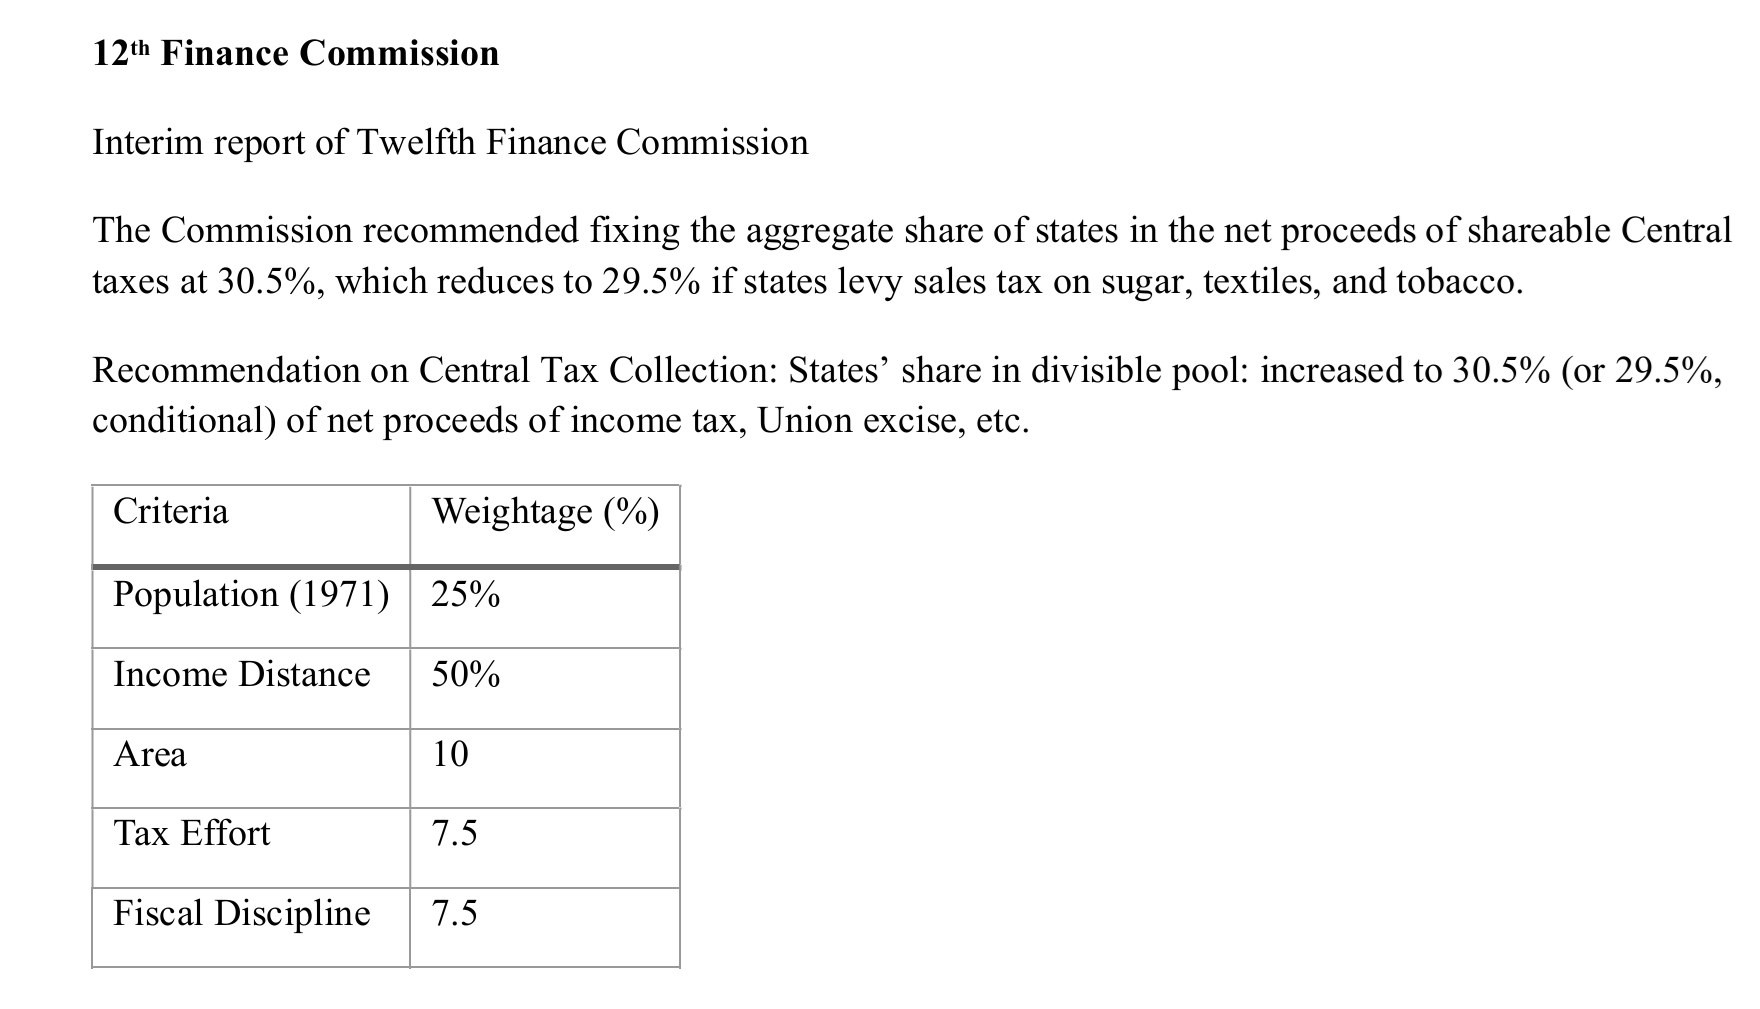
Fiscal devolution in India is governed by Article 280 of the Constitution, which mandates the Finance Commission (established every 5 years) to recommend the distribution of net tax proceeds between the Union and States.
The objective of India's Finance Commission is to act as a constitutional body that recommends the distribution of financial resources between the central government (Union) and the state governments, ensuring fiscal federalism and balanced growth.
Opposition leaders and academic commentators have accused the Centre of selective fund allocation to states supporting the ruling party, while neglecting opposition-ruled states.
States politically aligned with the ruling Central government tend to receive more fiscal transfers, while non-aligned states may be systematically disadvantaged in the devolution process.
Rather than relying on political conjecture, we examine this hypothesis empirically using Finance Commission formula data and weighted statistical analysis across three commission periods.
Total devolution received by aligned and non-aligned states across three Finance Commission periods:
| Finance Commission | Period | Total Aligned States (Rs Cr) | Total Non-Aligned States (Rs Cr) | Ratio (A/NA) |
|---|---|---|---|---|
| 12th FC | 2005-2010 | ₹1,08,892 | ₹96,054 | 1.134 |
| 13th FC | 2010-2015 | ₹2,18,456 | ₹2,09,918 | 1.040 |
| Transition Year | 2014-2015 | ₹37,780 | ₹1,67,260 | 0.226 |
| 14th FC | 2015-2020 | ₹2,82,654 | ₹3,62,975 | 0.779 |
| TOTAL (2005-2020) | 15 Years | ₹6,47,782 | ₹7,36,207 | 0.880 |
Key Insight: Over the 15-year period (2005-2020), non-aligned states collectively received more fiscal transfers (₹7,36,207 Cr vs ₹6,47,782 Cr), with the ratio of 0.880 indicating institutional neutrality and absence of sustained political bias in fiscal devolution.
Key Feature: Heavy weightage on Income Distance (50%) to support economically backward states.
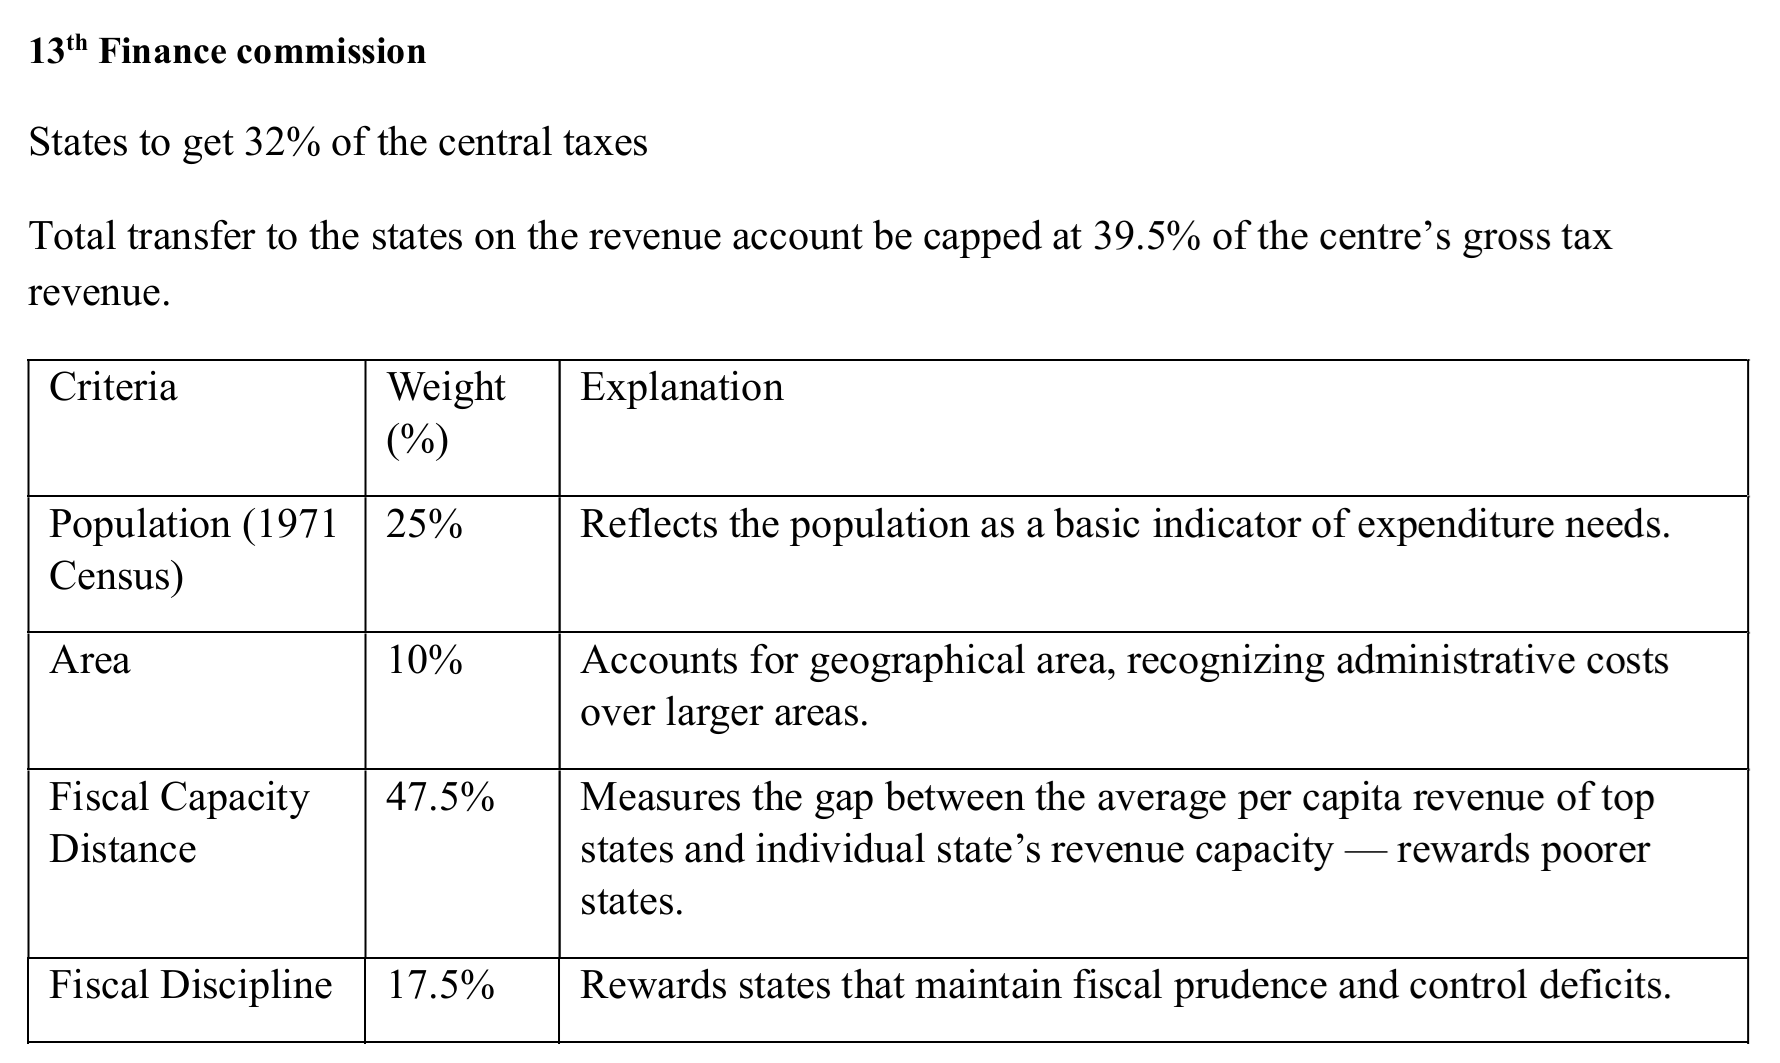
Key Change: Introduced Fiscal Discipline (17.5%) as major criterion, increased Fiscal Capacity Distance to 47.5%.
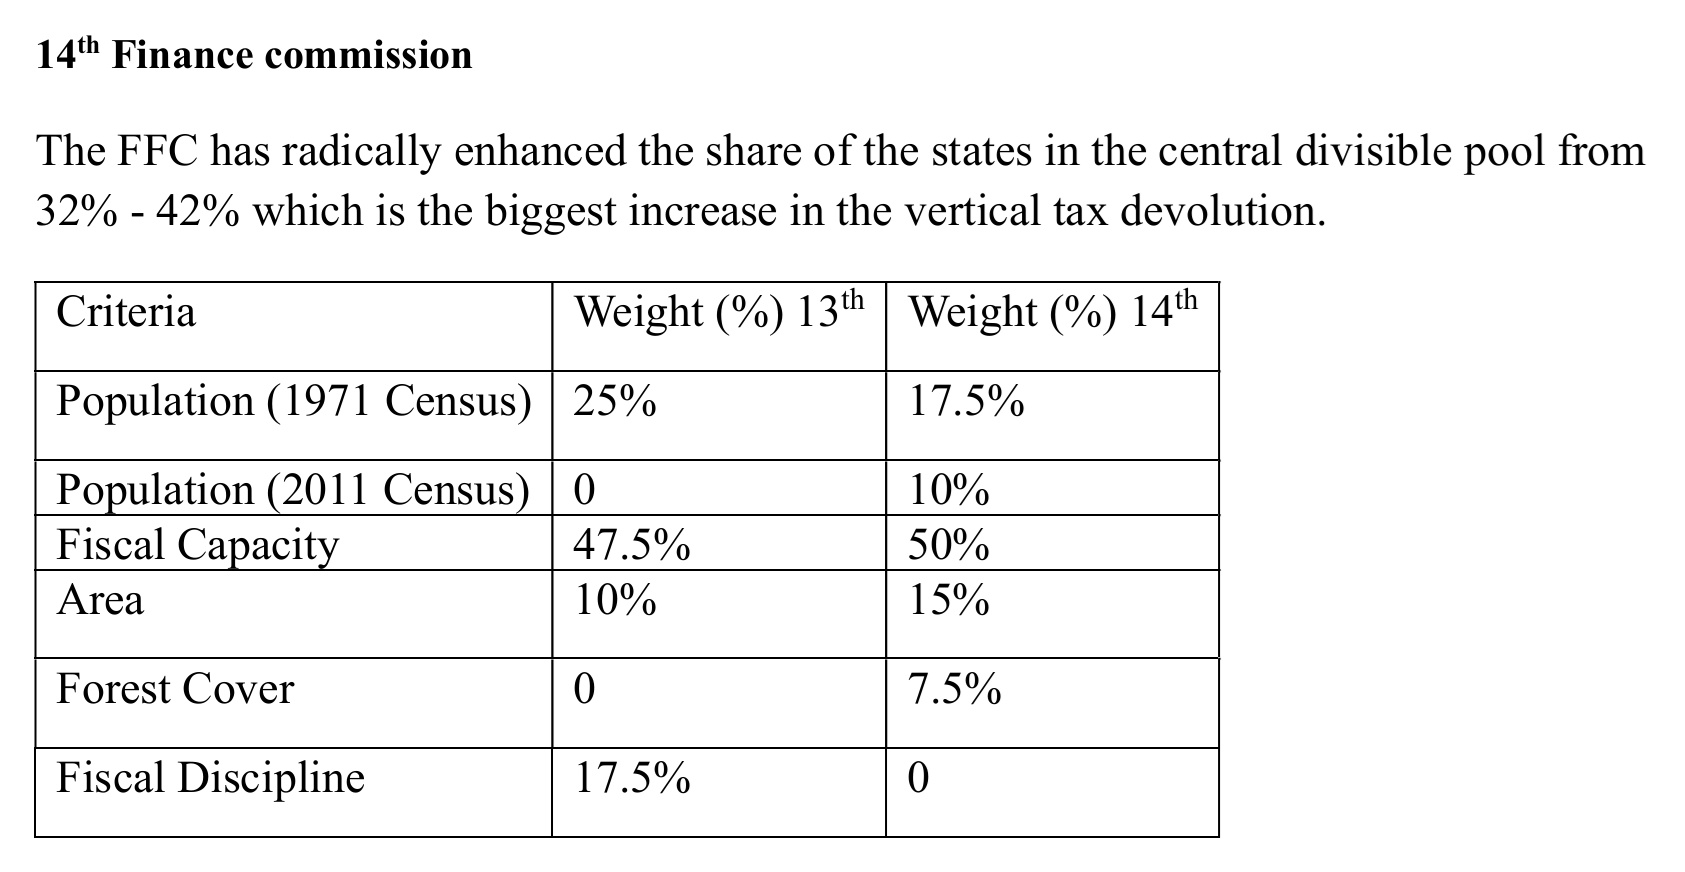
Radical Reform: Increased state share from 32% to 42%, eliminated Fiscal Discipline, added Forest Cover (7.5%) and 2011 Census population (10%).
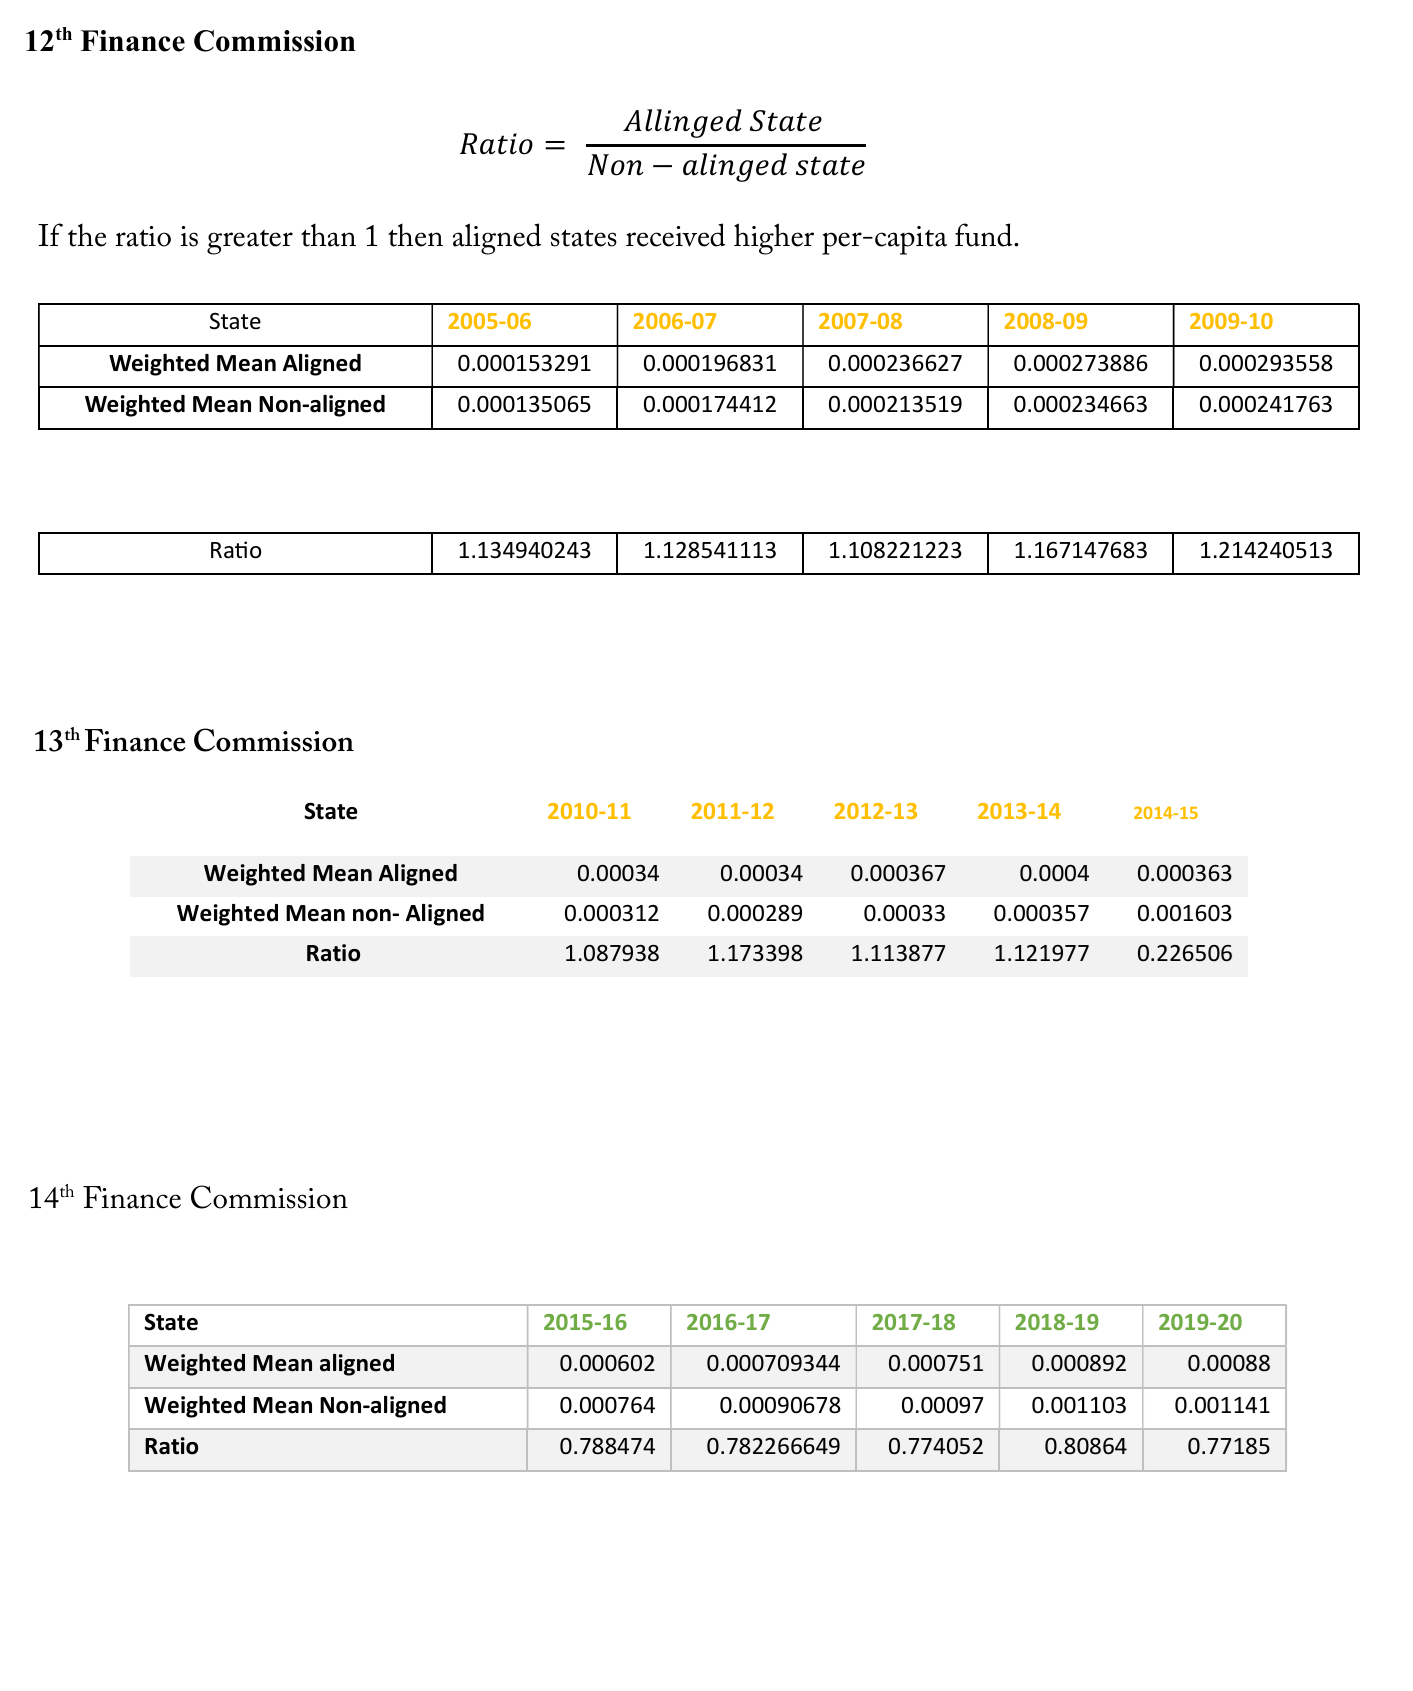
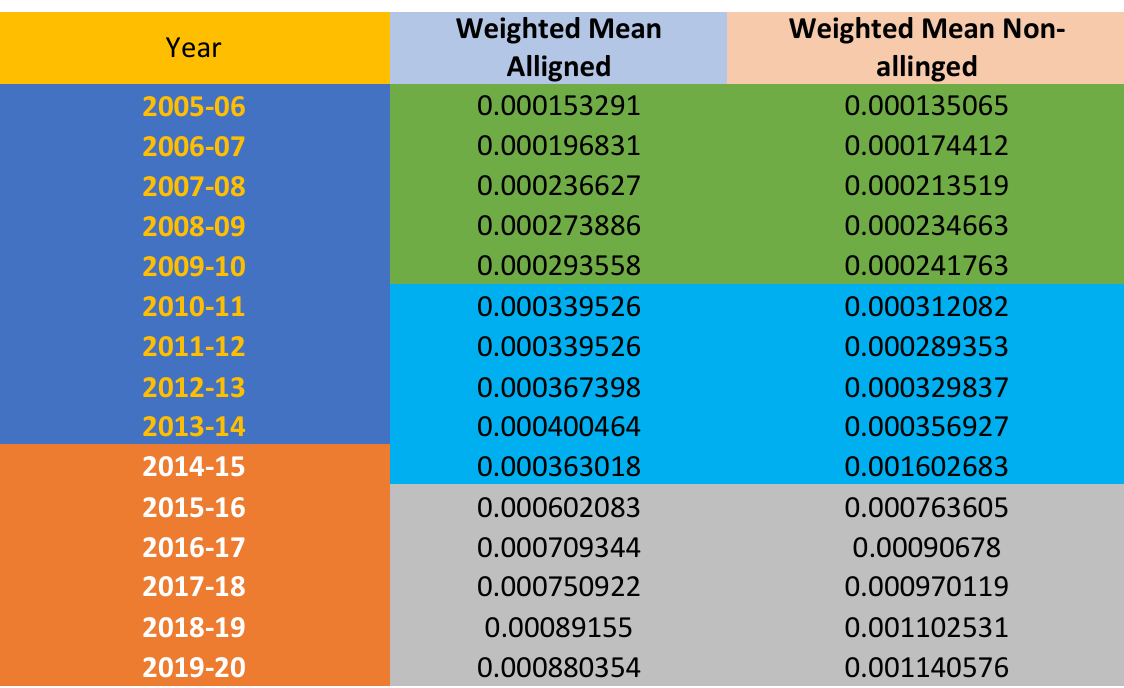
Weighted mean per capita devolution across all three commission periods showing the evolution of fiscal allocation patterns:
Observation: Clear pattern shift — pro-alignment (12th FC) → transitional (13th FC) → institutional neutrality (14th FC)
Pattern: Pro-Alignment Bias
Ratio: 1.108 - 1.214
Cause: Formula weights favoring income distance and population benefited certain economically-aligned states. However, this could be coincidental rather than deliberate.
Pattern: Transitional Mixed Phase
Ratio: 1.088 - 0.227 (sharp drop)
Cause: Political regime change (INC→BJP), demonetization, macroeconomic shocks — not structural formula bias.
Pattern: Post-Reform Neutrality
Ratio: 0.772 - 0.809
Cause: Structural formula reforms increased state autonomy and benefited non-aligned/regional-party states, proving institutional insulation.
Pattern: Progressive Institutional Maturation
Direction: From discretionary allocation → formula-based transparency
Implication: Long-run evidence suggests successful reduction in political discretion and strengthening of cooperative federalism.
India's fiscal devolution system has progressively evolved from discretionary decision-making toward formula-based institutional frameworks with reduced political discretion over the 15-year period.
Apparent disparities in per-capita transfers reflect evolving Finance Commission criteria, demographic transitions (2001→2011 census), macroeconomic adjustments, and state-specific factors rather than partisan favoritism.
The sharp reversal in 2014-15 coincided with political regime change, demonetization, fiscal consolidation efforts, and the transition between commission periods — creating temporary distortion that was transitional rather than politically motivated.
The consistent pro-non-aligned pattern under 14th FC provides compelling evidence that structural formula reforms, not political factors, drive fiscal allocation decisions in India's federal system.
Mild pro-alignment bias detected. Attributable to formula structure (income distance, population weights) rather than deliberate political discretion. Many poorer states coincidentally aligned with ruling party.
Transitional period with sharp reversal in 2014-15 reflecting political regime change and macroeconomic disruptions, not structural bias in the Commission's formulaic approach.
Near-complete institutional insulation: Non-aligned states received significantly HIGHER transfers despite BJP rule, proving neutrality of reformed formula and increased state autonomy.
Progressive evolution from discretionary allocation toward formula-based, transparent, institutionally neutral fiscal devolution. Political bias, if present, is neither uniform nor persistent.
Fiscal devolution from 2005 to 2020 remained largely formula-based and institutionally neutral. While the 12th FC showed mild alignment favor, the 14th FC actually favored non-aligned states.
The Finance Commission has evolved into a robust institution. The shift toward formula-based devolution has reduced the scope for discretionary political favoritism and strengthened cooperative federalism.
While minor year-to-year variations exist due to macroeconomic factors and formula transitions, the long-run evidence demonstrates that India's Finance Commission system has successfully upheld fiscal neutrality, equity, transparency, and constitutional principles in fiscal devolution. The apparent concerns about political bias are not substantiated by the empirical data across the three commission periods studied.
Questions & Discussion
Biswajit Mukherjee
Ramakrishna Mission Vidyamandira, Belur Math
Department of Economics | B.Sc. Economics (Hons)